
Cameras as Sensors: Turning Video Into Operational Data
March 5th, 2027
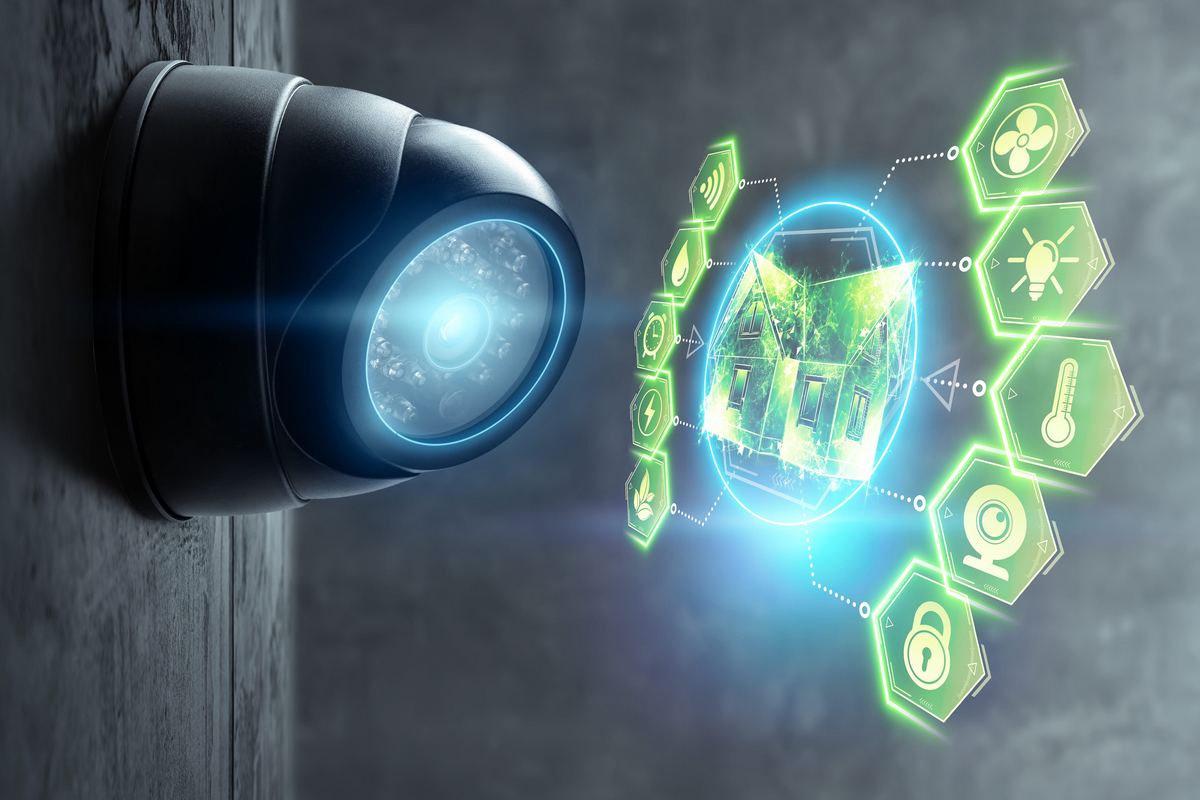
Most security cameras spend their lives recording events nobody watches. The footage is there for insurance claims and investigations, and the rest of the time it sits on a hard drive. That is a lot of infrastructure for a single purpose.
Modern cameras can do more. With analytics software, the same footage can count people, measure queues, estimate occupancy, and show how a space is actually used. The camera becomes a sensor. Security remains the foundation, but operations gain a steady stream of information that is difficult to collect any other way.
From Recording to Measuring
The shift is not about watching more video. It is about extracting numbers and trends from video so people do not have to watch it at all. Analytics software defines regions of interest, counts objects that cross a line, measures how long people wait in a zone, and produces reports.
That changes the daily use of the system. Instead of reviewing footage after an incident, managers review dashboards that show what happened across the week.
People Counting
People counting shows how many customers, visitors, or employees enter a space and when. For retail, it helps compare foot traffic with sales. For offices, it shows which entrances and floors are busiest. For service businesses, it helps match staffing to demand.
The data is more useful when paired with another source. A store that sees steady traffic but flat sales may have a merchandising or staffing problem. An office that sees heavy Monday and Tuesday traffic but light Friday traffic can adjust cleaning, security, and space planning.
Queue and Service Levels
Queue analytics measure how many people are waiting, how long they wait, and whether the line is growing. Alerts can fire when a wait time crosses a threshold, giving managers time to open another register or assign another service representative.
Historical queue data is just as valuable. It shows which hours consistently need more coverage and which staffing schedules create bottlenecks. That turns scheduling from a guess into a forecast.
Space Utilization
Occupancy monitoring shows which rooms, desks, and common areas are actually used. In a hybrid office, that information supports decisions about desk ratios, conference room size, and cleaning schedules.
In warehouses and production areas, movement data can reveal inefficient layouts. If forklifts or employees repeatedly cross the same congested area, the layout may be creating delays that no one has measured.
Safety and Process Compliance
Analytics can detect whether a person entered a restricted area, whether safety equipment is being worn in a designated zone, or whether a door was propped open longer than policy allows. It can also document whether a process was followed, such as sanitizing a station between customers.
These checks should support training and improvement, not surveillance for its own sake. The goal is to find where the process breaks down and fix it.
Integrating Video With Business Systems
The value multiplies when video data connects to other systems. Point-of-sale integration shows what customers did before a purchase. Access control integration shows who entered a facility and when. Scheduling systems can compare planned coverage with actual demand.
Start with one integration that answers a specific question. For example, connect people counting to the point-of-sale system to compare traffic and conversion by hour. If the data does not change a decision, the integration is not worth the effort.
Privacy and Transparency
Operational analytics can feel intrusive if employees do not understand what is being measured. Be clear about the purpose, the data collected, and who can access it. Use aggregate counts where possible instead of identifying individuals.
Many systems support privacy masking, which blurs faces or sensitive areas while still allowing counting and movement analysis. Review retention periods and access controls. Video data is sensitive data, and it belongs in the security program alongside email and customer records.
Check local and state requirements for notice, consent, and retention. Post signage where required, and make sure the policy matches what the system actually does.
Start With a Question, Not a Camera
The most common mistake is buying analytics because it sounds impressive, then looking for something to measure. Start with a business question instead:
- Are we staffing the front desk at the right times?
- How long do customers wait before someone helps them?
- Which areas of the store get traffic but no sales?
- Are conference rooms being used, or are we paying for empty space?
- Are safety procedures followed consistently across shifts?
Then pick the camera locations, analytics, and reports that answer the question. A pilot on one entrance or one service counter is enough to test the idea before expanding.
What to Measure After the Pilot
Compare the new data with the decision it was meant to improve. If staffing was the question, did wait times fall? If space utilization was the question, did the company avoid leasing more space? If safety was the question, did compliance improve?
Also measure the operational cost of the system itself. Is someone reviewing the reports? Are alerts creating noise? Are privacy controls working as intended? Analytics only helps when it becomes part of a routine.
ATS designs video surveillance systems that start with security and extend into operational insight. If your cameras are recording but not informing decisions, contact our team to explore what the footage can tell you.
Posted in: Cybersecurity